|
|
|
| Finance | Download | Buy | Screenshots | Quotes | Transactions | Help | Retail |
| • About | • Introduction Tour to Retail | |||||||
Retail Software - retail metrics, sales analytics, and inventory management

|
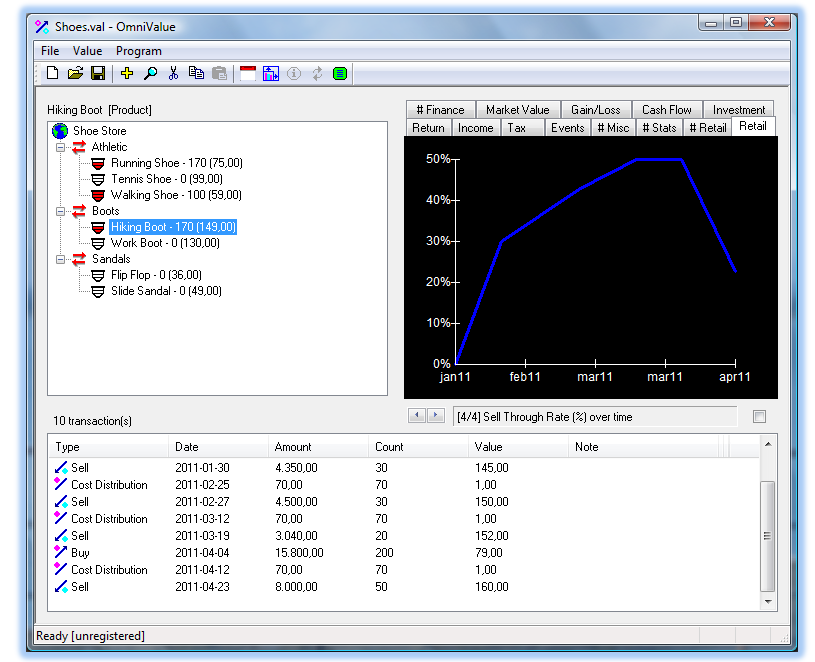
OmniValue for Retail. OmniValue 4.0 introduces new functionality for retail businesses. Product inventory and turnover, contribution and sales margin, as well as other key retail metrics for selling of products are calculated based on transaction data imported either directly from Point of Sale systems or from daily totals. It is now possible to seamlessly analyze sales of retail products and manage inventory alongside financial investments in the same metric and graph analysis framework of OmniValue 4.0. |
OmniValue™ for Retail is a powerful tool for analyzing sales of retail products and managing the inventory. It is suitable for small to medium sized retail businesses which have a need to understand the profitability and performance of sales and the efficiency of inventory management (replenishment and inventory levels). OmniValue provides key metrics widely used in the retail industry to make merchandizing and replenishment decisions. Metrics and graphs are generated from sales data which can be imported from virtually any format into OmniValue.
The following metrics and graphs are automatically generated by OmniValue at all levels of the document (Product, Product Department, and Store).
| Metric | Definition |
| Sales | Total money amount collected for products provided. |
| Margin (%) | A ratio of profitability calculated as net income divided by sales. |
| Gross Margin ROI | The Gross Margin Return on Inventory Investment ratio describes the income generated by money spent on inventory. A high GMROI indicates a good balance of sales, margin, and inventory cost. A rule of thumb is that a GMROI of at least 3.2 is the breakeven for a business. |
| Contribution | Sales price minus variable cost per product. |
| Cash flow | The amount of cash a product generates and uses. This is calculated as cash receipts minus cash payments. |
| Inventory Turnover | A measure of the number of times inventory is sold in a time period. A low turnover implies poor sales and, therefore, excess inventory. A high ratio implies either strong sales or ineffective inventory levels. |
| Days of Supply | Estimate of how long the inventory will last in days given the current rate of sales. |
| Sell Through Rate (%) | Sell through rate is the percentage of units sold from inventory during the period. Sell through is typically evaluated on a daily basis for fast moving products or weekly for slower moving or replenishment based products. A higher value is better indicating good sales velocity and appropriately forecasted inventory. |
| Stock to Sales ratio | The ratio of the inventory available for sale to the quantity sold. A merchandising goal is to reduce the Stock to Sales Ratio as low as possible, without losing sales. |
An inventory of products in a retail business is also a financial value and hence the financial metrics in OmniValue also applies to retail product values. These metrics and graphs are also available in OmniValue and provide further key insights into investment, return, market value, gain/loss, risk and much more.
To learn more about OmniValue, you can read the Introduction tour for Retail, look at screen shots or download the application.