![]()
This page gives a quick introduction to OmniValue for Retail. OmniValue for Retail is a tool for analyzing sales of retail products and gaining insights into relevant metrics such as sales margin, sales contribution, gross margin return on investment, inventory turnover, days of supply, sell through rate, and stock to sales. The first chapter describes how a document is structured and how to use a template to quickly setup a document describing sales of retail products. In the second chapter it is explained how data can be input either manually or in an automated procedure using import/export scripts. In the last chapter it is explained how metrics are evaluated and how metrics and graphs can be used to understand the profitability of retail sales and inventory management.
A tutorial for managing and analyzing financial investments is also available. It contains additional information on how to use OmniValue. Continue here for the OmniValue Finance tutorial.
1. Creating the document
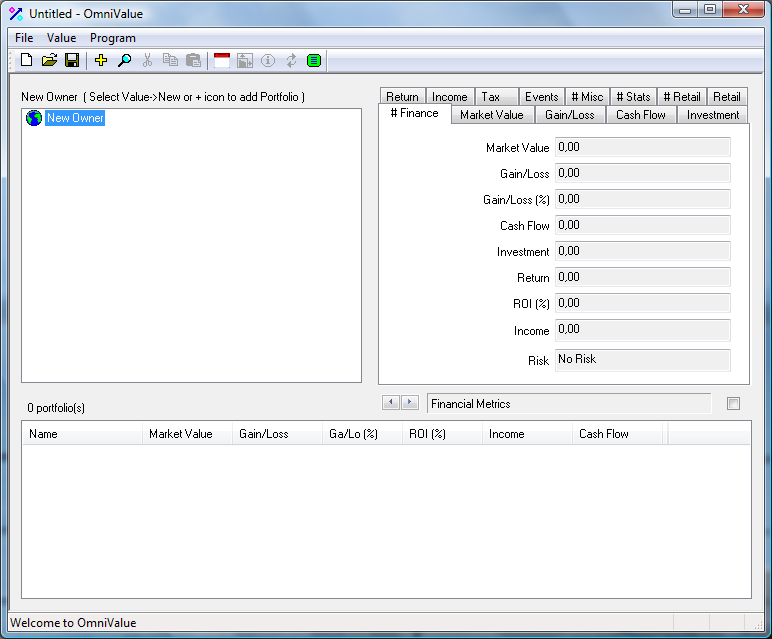
After starting OmniValue the following window is shown on the screen:
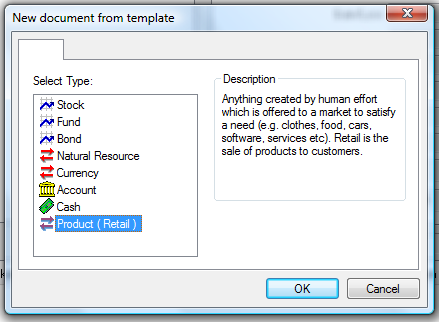
To create a document for Retail select menu File->Template. In the dialog select type "Product":
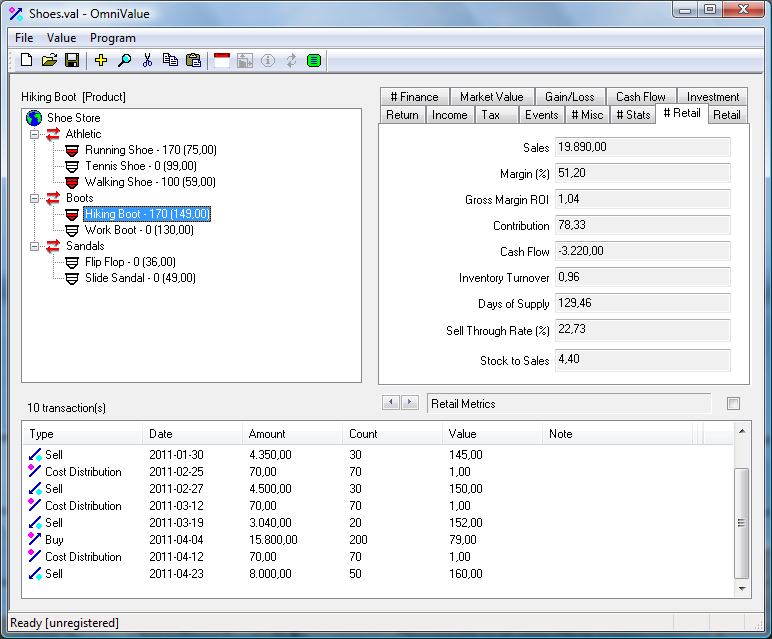
The template for products looks like the following. Note that the metrics view in the top right hand panel has shifted automatically to show Retail metrics. Select any tab in the panel to view other metrics or graphs for the currently selected value.
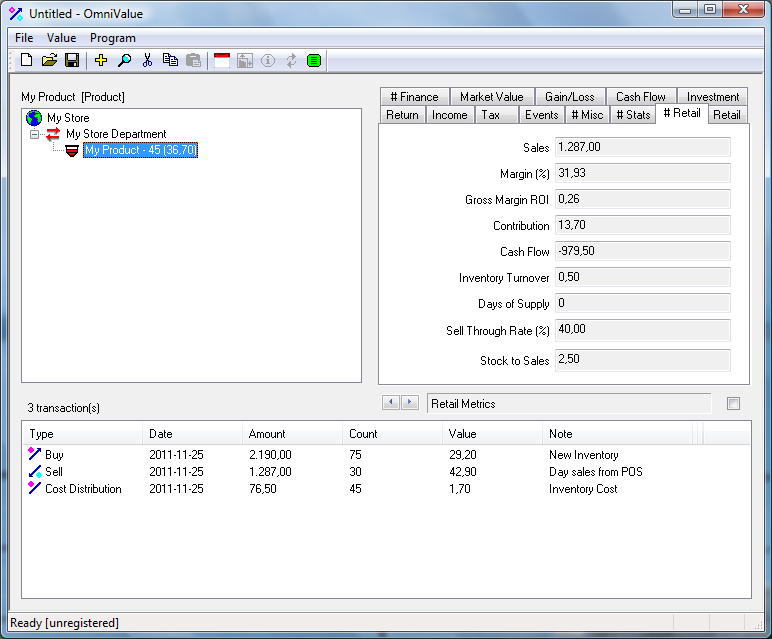
The tree structure in the top left explorer represent entities in a retail business. The following definitions are used:
- Top level (owner): the top level corresponds to the store itself (physical shop or E-Commerce site on the internet)
- 2nd level (portfolio): This level corresponds to a product department containing products of similar type
- 3rd level (asset): product level
Transactions are defined for products at the product level. In the template three types of transactions are shown:
- Buy: use this transaction to replenish inventory for a product
- Sell: use this transaction to describe sales of a product
- Cost Distribution: use this transaction to account for the inventory cost of a product
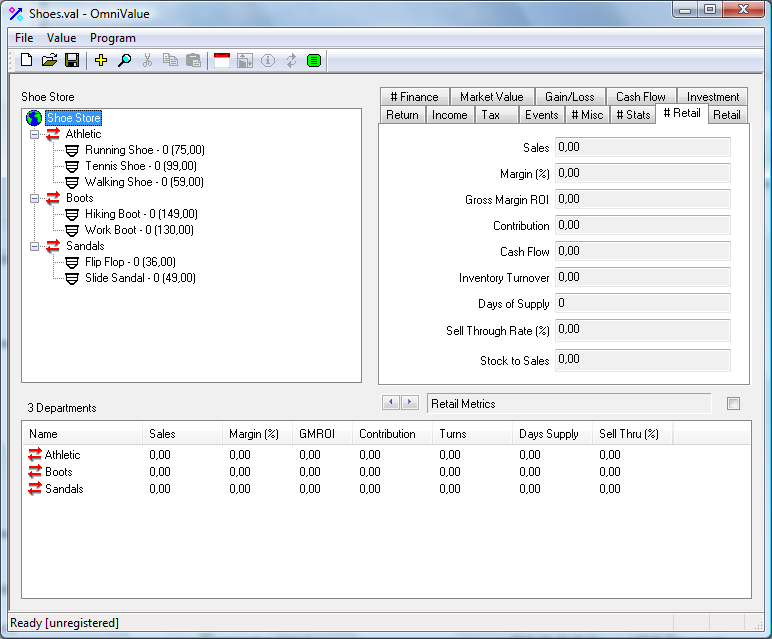
Using the above definitions the following view is showing a sample OmniValue document for retail sales at a shoe store. Note that the document does not contain any transactions and hence is showing 0 for all metrics. The next chapter will explain how transactions can be added to an OmniValue document.
2. Adding Data
This chapter will explain how transactions can be added to an OmniValue document. Transactions are events which describe changes in Sales, Cost and Inventory. The types of transactions that can be used for products in a OmniValue Retail document are:
| Icon | Name | ID | Description |
| Buy | 110 | Use this transaction for replenishing inventory where the purchase price per product is specified. A transaction fee can also be specified. | |
| Buy Total | 120 | Use this transaction for replenishing inventory where the total purchase price for all products is specified (including any transaction fee). | |
| Cost Distribution | 251 | Use this transaction to add inventory cost per product. Use a positive value to increase cost, a negative value to decrease cost. | |
| Cost Distribution Total | 261 | Use this transaction to add a total inventory cost for all products. Use a positive value to increase cost, a negative value to decrease cost. | |
| Sell | 310 | Use this transaction for a sales from POS where the price per product is specified. | |
| Sell Total | 320 | Use this transaction for a sales from POS where the total price is specified. | |
| Clearance | 410 | Use this transaction for a sale of all products where the price per product is specified. | |
| Clearance Total | 420 | Use this transaction for a sale of all products where the total price is specified. |
To add transaction data to OmniValue it is recommended to use daily totals. I.e. individal Point Of Sale transactions should first be aggregated into daily totals per product and subsequently input to OmniValue as daily sales transactions.
Transactions can be added in two ways:
- Manually in the windows GUI (menu Value->New)
- From a data file or spreadsheet using the Import function (menu Value->Import)
1. Manual Entry in GUI
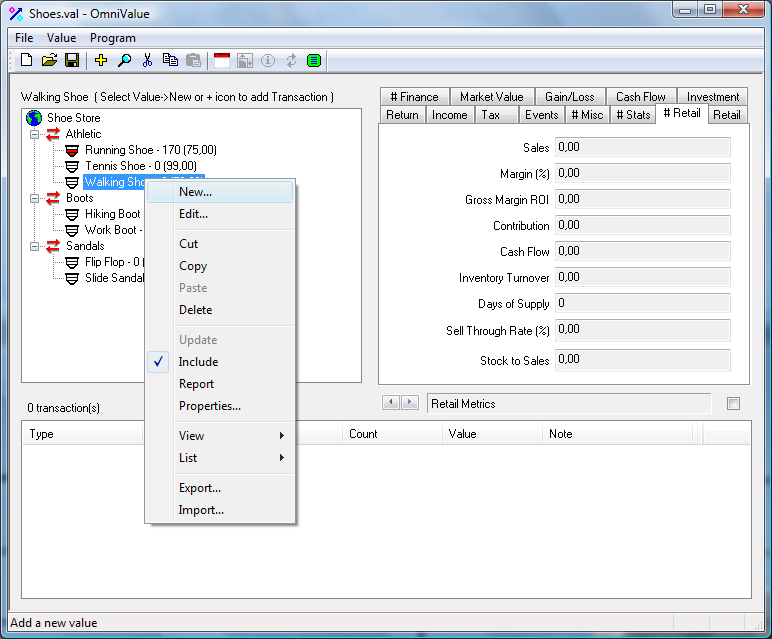
To add a transaction in the GUI, select the product and select menu Value->New... (or click the + icon on the toolbar). In the new transaction dialog, select e.g. a Buy transaction to replenish the inventory.
Add data for the transaction and click finish to add it to the product.
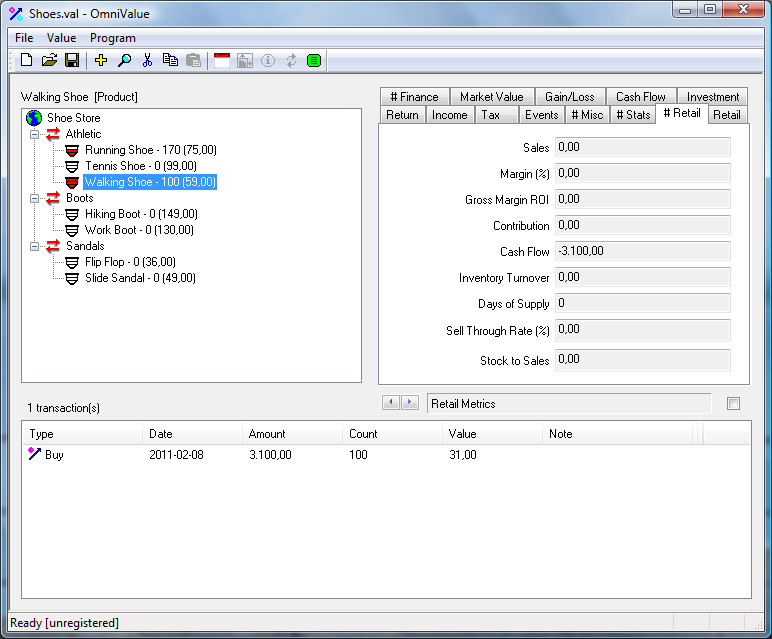
The main view after adding the transaction will look like:
2. Import from file
The second way of adding transactions is to import the transactions from a data file. The data file can be e.g. a daily extract from the POS system. Importing from file is suitable if the amount of data is large or if transaction data must be added often.
OmniValue provides a flexible import functionality which can be adapted to most formats from other systems. By default OmniValue provides a standard format. An example of a source data file using the standard format is:
# Transaction data from POS system and inventory
# Product;Transaction;ID;Record Date;Payment Date;Count;Unit Value;Amount;Fee;Portfolio;Note
Hiking Boot;Buy;110;2011-01-04;2011-01-14;100;70;*;0;;
Hiking Boot;Cost Distribution;251;2011-01-29;2011-01-19;*;1;*;0;;
Hiking Boot;Sell;310;2011-01-28;2011-01-30;30;145;*;0;;
Hiking Boot;Cost Distribution;251;2011-02-25;2011-02-25;*;1;*;0;;
Hiking Boot;Sell;310;2011-02-28;2011-02-27;30;150;*;0;;
Hiking Boot;Cost Distribution;251;2011-02-20;2011-03-12;*;1;*;0;;
Hiking Boot;Sell;310;2011-03-30;2011-03-19;20;152;*;0;;
Hiking Boot;Buy;110;2011-04-07;2011-04-04;200;79;*;0;;
Hiking Boot;Cost Distribution;251;2011-02-20;2011-04-12;*;1;*;0;;
Hiking Boot;Sell;310;2011-04-29;2011-04-23;50;160;*;0;;
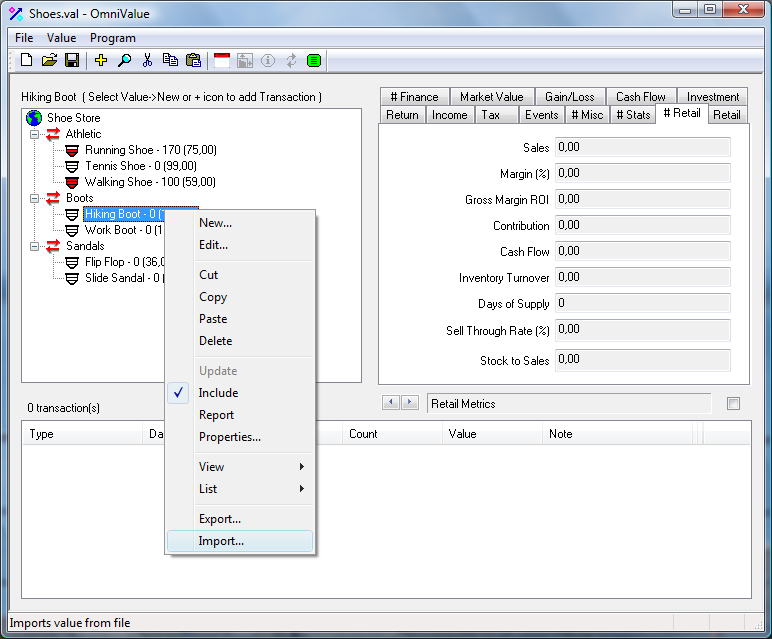
To import transactions from a data file select the product and select menu Value->Import as shown in the following view:
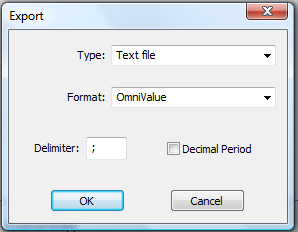
In the Import dialog make sure the type is "Text File" and the format is "OmniValue":
In the next step select the file to import transactions from. After completing the import dialogs the main view will be updated with the new transactions for the selected product:
Note that if the file has a data format different from the standardformat an import/export script (impex) has to be used to enable import into OmniValue. Definition of impex scripts is further described in the tutorial for import/export.
3. Business intelligence and insight through metrics and graphs
The following metrics for retail are used to describe values in the form of products in OmniValue. They are measures of the profitability of sales of products and of the efficiency of the inventory management. All definitions are valid in the context of a given accounting period. All definitions refer to an product (i.e asset of type Product) but they are also valid for a portfolio (product department) or an owner (typically the store).
Retail metrics are automatically calculated at all levels in the document and are shown in the tab for "# Retail" in the GUI.
| Metric | Definition |
| Sales | Total money amount collected for products provided. |
| Margin (%) | A ratio of profitability calculated as net income divided by sales. |
| Gross Margin ROI | The Gross Margin Return on Inventory Investment ratio describes the income generated by money spent on inventory. A high GMROI indicates a good balance of sales, margin, and inventory cost. A rule of thumb is that a GMROI of at least 3.2 is the breakeven for a business. |
| Contribution | Sales price minus variable cost per product. |
| Cash flow | The amount of cash a product generates and uses. This is calculated as cash receipts minus cash payments. |
| Inventory Turnover | A measure of the number of times inventory is sold in a time period. A low turnover implies poor sales and, therefore, excess inventory. A high ratio implies either strong sales or ineffective inventory levels. |
| Days of Supply | Estimate of how long the inventory will last in days given the current rate of sales. |
| Sell Through Rate (%) | Sell through rate is the percentage of units sold from inventory during the period. Sell through is typically evaluated on a daily basis for fast moving products or weekly for slower moving or replenishment based products. A higher value is better indicating good sales velocity and appropriately forecasted inventory. |
| Stock to Sales ratio | The ratio of the inventory available for sale to the quantity sold. A merchandising goal is to reduce the Stock to Sales Ratio as low as possible, without losing sales. |
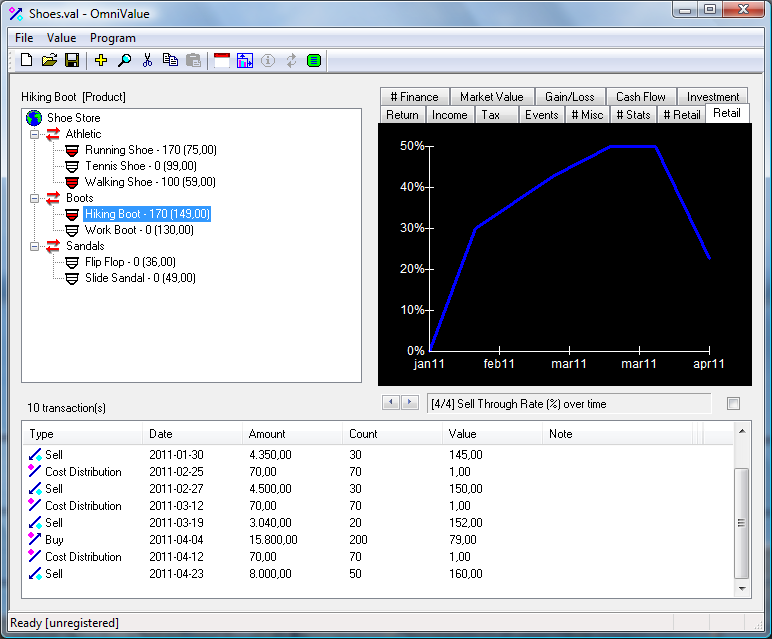
OmniValue also provides graphs of retail metrics. To view the graphs for Retail select the tab for "Retail" in the GUI. An example of the graph for sell through rate over time for a product is shown in the view below.
An inventory of products in a retail business is also a financial value and hence all financial metrics in OmniValue also applies to retail product values. These metrics and graphs can be found under the other tabs in the OmniValue GUI and provide further analysis and key insights into investment, return, market value, gain/loss, risk and much more. For an introduction to the financial metrics in OmniValue please continue with the OmniValue Finance tutorial.
All values in an OmniValue document can be viewed as web pages in a web browser (menu Value->Report). Viewing a value in a web browser will make it possible to print metrics and graphs on paper. It will also be possible to further process the text and graphics using office applications such as Microsoft Word and Microsoft Excel. When converting the internal OmniValue document format to web format, a number of web reports will be created out of a single value document.
© Milliplex