![]()
This page gives a quick introduction to OmniValue. A document containing a portfolio of stocks is created. Transactions are defined to describe the financial events in an asset. The data panel and the use of graphs is explained. It is shown how assets are updated from reference sources on the web and how reports in html format are generated. The settings for tax calculation and tax rates are explained and an example of using mixed currencies in a document is given.
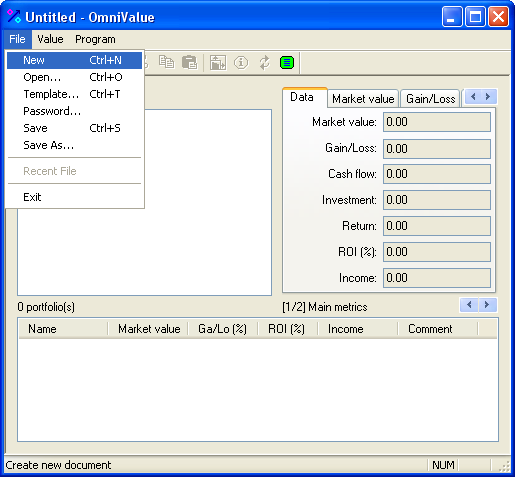
After starting OmniValue the following window will be shown on the screen:
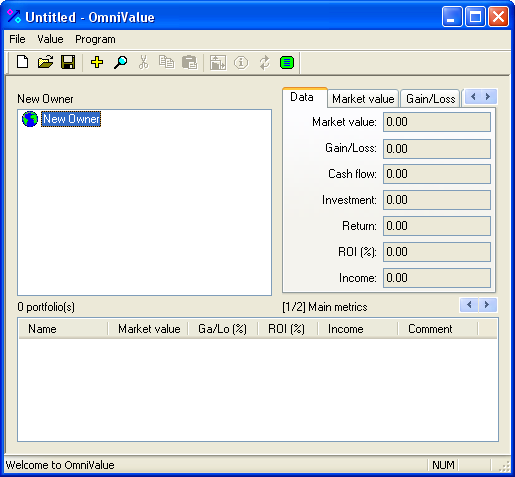
The main view of the user interface is divided into three parts:
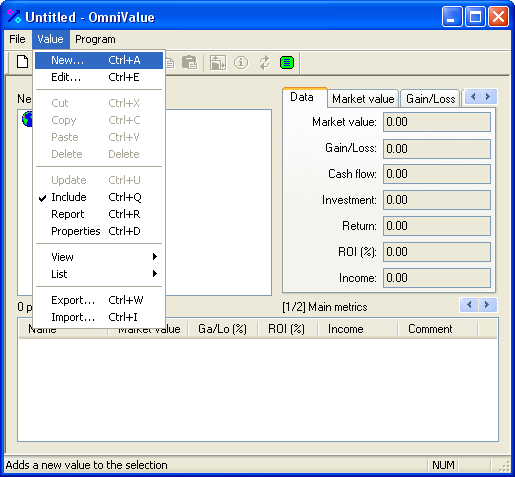
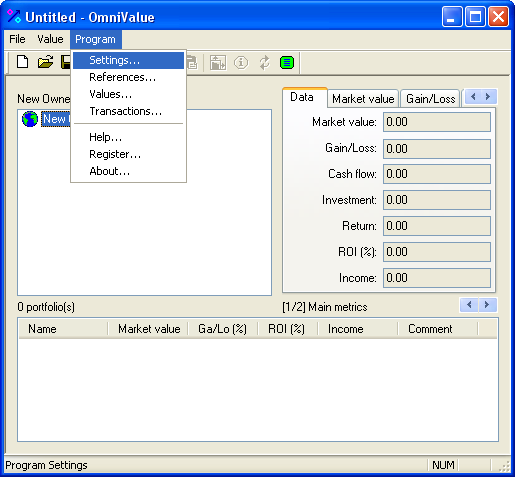
The menus are organized in 3 main categories: File, Value, and Program.
In order to define values in an OmniValue document, start by changing the name of the Owner. The owner represents assets that are owned by either a person or a company. There can only be one owner defined per document.
To change the name of the owner select the owner in the value explorer, and use one of the following options to edit the owner:
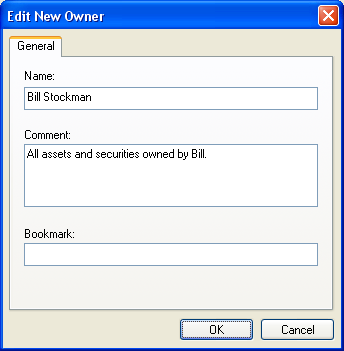
In the dialog, insert the name of the owner of the assets in the document. In this example, the name "Bill Stockman" is used. A comment may also be defined for the owner. A bookmark can be an URL to a web page on the Internet or it can be file path to a local document or a spread sheet.
The document should now be saved by selecting File>Save As... (or by clicking on the disk icon in the toolbar, or by pressing Ctrl+S). In this example, the document file is saved as "Bill Stockman.val". OmniValue uses the extension ".val" for all value documents.
A Portfolio represents assets which are of the same type, e.g. a portfolio of stocks, or a portfolio of bank accounts. In this example, a portfolio of stocks will be defined.
To create a portfolio use one of the following options:
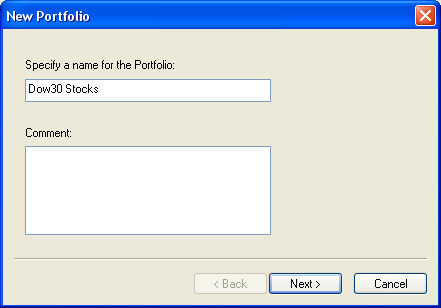
In the first step of the portfolio wizard, the name of the portfolio is defined together with an optional comment:
In the next step of the wizard, select the type Stock. Since the assets are not denominated in a foreign currency the option for defining an exchange rate should not be checked.
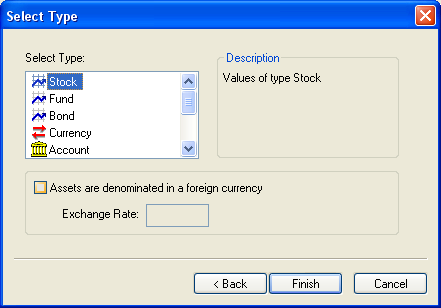
In OmniValue, a value must always be of a known type. The type specifies which transactions can be used, which tax rates are applicable, etc. The value type is always set when creating the portfolio and it can not be changed afterwards, neither in the portfolio, nor in the created assets.
An Asset in OmniValue is a direct representation of an actual financial asset. An asset can only be created in a portfolio and it always has the same valuetype as the portfolio.
In this example, an asset for the stock "IBM" will first be created. An asset is created by first selecting the parent portfolio in the value explorer and then selecting Value->New... from the menu (or by clicking on the + icon in the toolbar, or by pressing Ctrl+A).
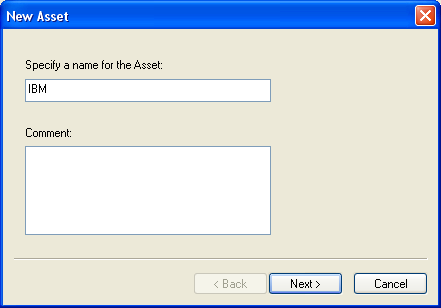
In the first step of the asset wizard, the name of the asset is defined together with an optional comment:
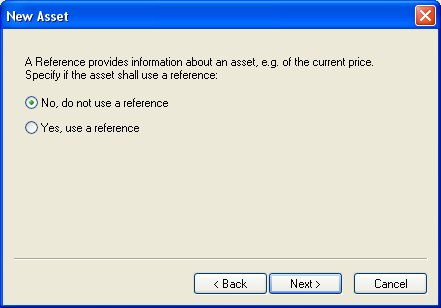
In the next step of the wizard it is specified whether the asset shall use a reference. If an asset is connected to a reference the present value of the asset may be updated from an external source, e.g. a web quote server on the Internet. Here, the asset is not connected to a reference.
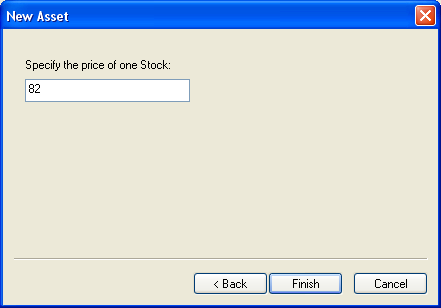
In the final step of the wizard, the price of one stock is specified. If the price of one stock is not known any value can be used since the price can always be changed at a later time.
In this section an asset with a reference will be created. A reference to an asset makes it possible to update the current value of the asset from an external source. A reference source can be a text file on a local computer, or a web site on the Internet providing e.g. stock quotes. More information on the concept of reference sources, and on how new sources can be defined is given in the chapter for references.
An asset with a reference will be created next. The asset has been named "Microsoft" in the first step of the asset wizard. In the second step, the option for using a reference is selected:

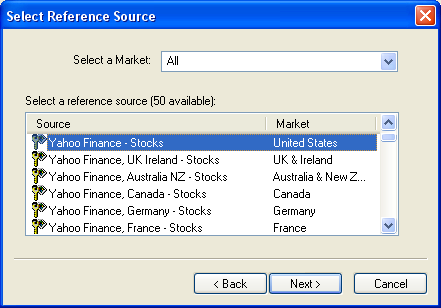
In the next step a reference source shall be selected. Start by selecting a market in the top drop down list. OmniValue provides predefined sources for many of the major financial markets in the world. To view sources for all markets, select "All" in the top list.
After selecting a market, select a reference source from the bottom list of reference sources. Here, the source Yahoo Finance is selected. Yahoo Finance provides market data for stocks traded in the United States.
In this example, the ticker symbol to use for Microsoft is MSFT. If the symbol for a company is not known, press the button for "Search Symbol..." in the bottom right of the window to search for a symbol based on the company name. If the required symbol is not showing in the list of references it must first be downloaded by defining the symbol in the lower left text field and clicking on the button for Update.
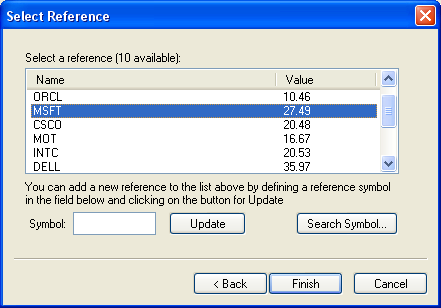
After selecting the reference symbol to use for the asset from the list of references, click on Finish to create the asset.
After having defined two stock assets in the document, the main view should now look like:
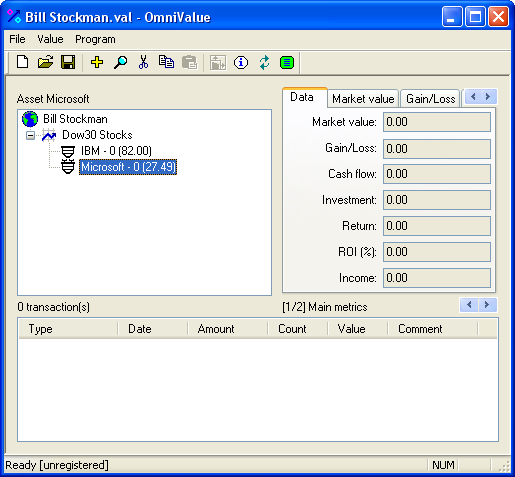
The value explorer contains an owner, a stock portfolio, and two stock assets. The hierarchical relationships depicted in the tree structure indicate that Bill Stockman owns the stock portfolio Dow30 Stocks, which consists of the two stocks IBM and Microsoft. The icon for Microsoft has an antenna on top, which indicates that there is an active reference to the asset available in the program. The text "Microsoft - 0 (27.49)" to the right of the icon indicates that there are 0 stocks in the asset, and that the value of one Microsoft stock is 27.49. The financial data for the Microsoft asset is shown in the data panel to the right. If a different item is selected in the value explorer the data panel will update to show the values for that item.
So far, the infrastructure for a value document consisting of an owner, a stock portfolio, and two stock assets has been defined. This structure by itself however, does not provide any real financial information about the investment in or the return of the assets. In order to describe financial data, transactions must be defined. A transaction describes a financial event in an asset such as a buy, a sell, a dividend, or a split.
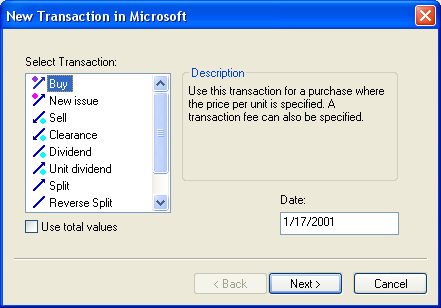
To create a transaction in the Microsoft asset, select the asset in the value explorer, and use one of the following options to create a transaction:
In the first step of the transaction wizard the type of transaction is selected. In this example a Buy transaction is selected and the date is set to 1/17/2001.
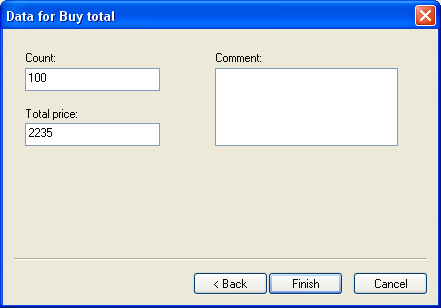
In the last step of the wizard, the data for the Buy transaction is defined. In this example, 100 stocks at the price of 22 is purchased. The brokerage fee for the purchase was 35.
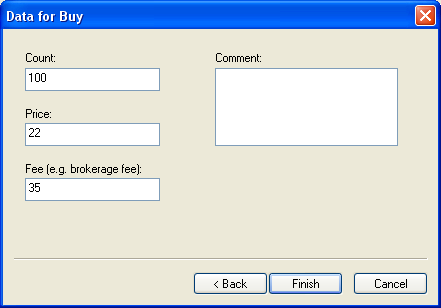
The Buy transaction makes it possible to set the price per stock and to define a brokerage fee for the transaction. OmniValue offers an alternative way of specifying data for a transaction through the use of total values. Using total values for a transaction means that instead of separately specifying the price per stock and the transaction fee, the total price for all stocks is specified (including any fees). To use total values in a transaction, check the box for "Use total values" in the first step of the transaction wizard. If total values had been used for the Buy transaction specified above, the last step in the wizard would have looked like the following (the total price is calculated as 100 * 22 + 35 = 2235):
After having defined a Buy transaction for Microsoft, the main view should now look like:
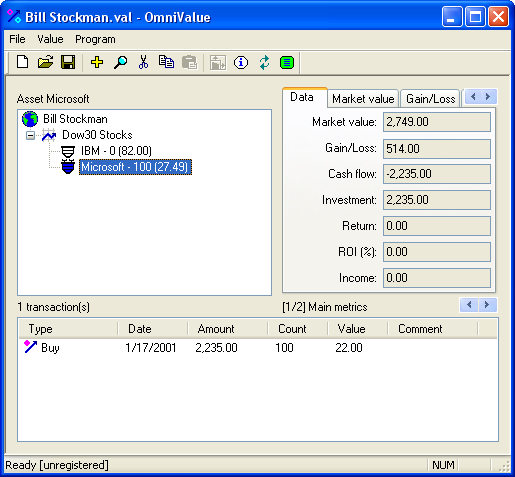
The buy transaction is now showing in the transaction list. The data that was defined in the transaction wizard have been listed in different columns in the list. In the value explorer the icon for the asset has changed to be completely filled with color. This indicates that the asset contains units of value, and that there has only been investment in the asset . In the data panel to the right of the value explorer, the numbers for Market value, Gain/Loss, Cash flow, and Investment has changed to include the buy transaction.
The data panel displays financial data for the currently selected value in the value explorer. The data is presented as:
The graphs provide a more detailed information about the transactions in a value, and illustrate how a financial metric changes over time, per element, and by the type of value.
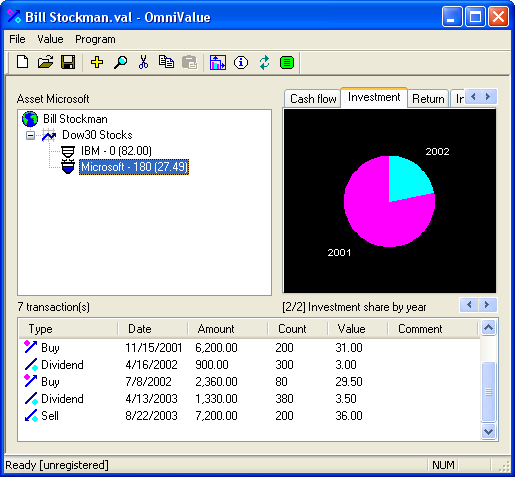
In the continuation of the example document, a few more transactions has now been added to the Microsoft asset (buy, sell and dividends). After selecting the tab for Market value in the data panel, the following view is shown:
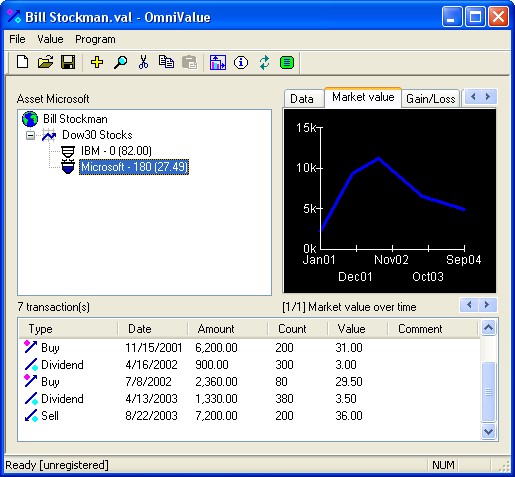
When the market value of an asset increases it is because there has been an increase in the number of units in the asset (e.g. buy transactions), or because the price of one unit has increased. Conversely, if the market value decreases there has been a decrease in the number of units (e.g. sell transactions), or the unit price has decreased. For example, the reason that the graph of market value in Microsoft continues to fall after the last transaction is because the price of one Microsoft stock has gone down since that transaction.
In order to view investments in the Microsoft asset, select the tab for Investment. For an asset, the graph will show investment by year, going 5 years back in time, the first year including all previous years. In this example, the graph shows that there has been investment in the asset 1998 and 1999. In order to find out the exact values for a specific year, click on the bar for the year and a message box will display the exact value.
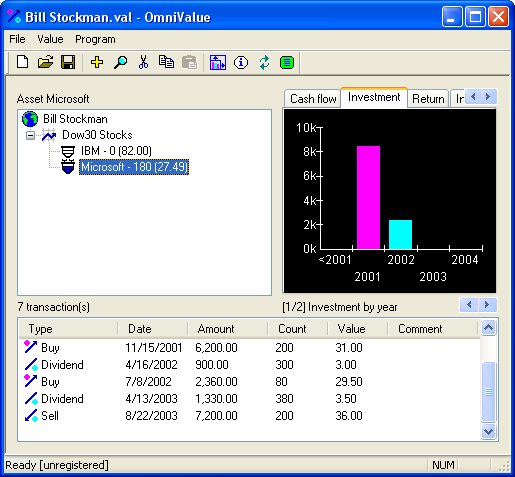
The caption for the graph is showing below the data panel, text "(1/2) Investment by year". The index (1/2) indicates that the current graph is graph 1 out of 2. In order to navigate to the second graph, push on the arrow buttons to the right, below the graph (or use the left and right arrow keys on the keyboard). The following graph is shown:
In the continuation of the example document a number of transactions have been added to the IBM asset. When the portfolio "Dow30 Stocks" is selected in the value explorer, the data panel will show the financial data for the portfolio. All values for the portfolio are cumulated from its assets, since it is only assets that can contain transactions and create financial values. For example, when the tab for Return is selected in the data panel for the portfolio, the following view will be shown:
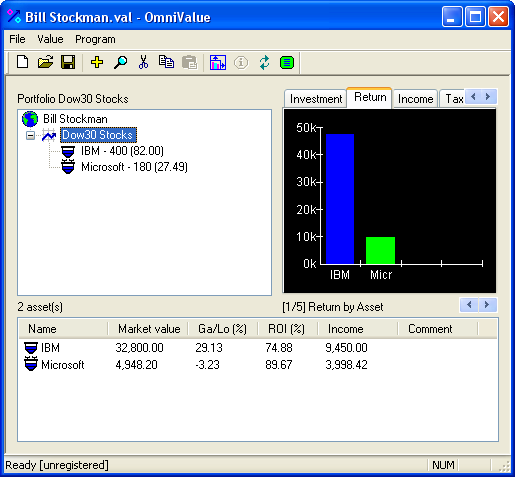
The graph illustrates which of the assets that has generated the most return in the portfolio. In this way, a portfolio can be used as an instrument for understanding the "performance" of the assets, as measured in a number of financial metrics.
The same upward accumulation of values that apply between assets and the portfolio, also apply between portfolios and the owner. From this viewpoint, the owner offers yet another level of calculation of cumulated values, and performance metrics. The difference is that the owner cumulates values from different value types. Hence, if the owner has assets comprising of both stocks and bank accounts, they will all be included in the calculations at the owner level.
If an asset has an active reference in the program, i.e. an icon with "antennas" on top, the current value of the asset can be updated from an external reference source. If a portfolio contains assets which have references the portfolio can also be updated. An update in this case means that all assets in the portfolio which have a reference will be updated, one by one. In a similar fashion, updating the owner will update all assets with references in the entire document.
In order to update a value, select the value in the value explorer and use one of the following options:
All values in an OmniValue document can be viewed as web pages in a web browser. Viewing a value in a web browser will make it possible to print financial data on paper. It will also be possible to further process the text and graphics using a word processor such as Microsoft Word. When converting the internal OmniValue document format to the html format, a number of html pages will be created out of a single value document. The pages are connected to each other through links, and the user will be able to "surf" around in the web of assets that is defined in the original value document.
In order to create a web report for a value, select the value in the value explorer and use one of the following options:
OmniValue will use the standard web browser on the system to display the pages.
OmniValue provides a mechanism for handling of different currencies within a document through definition of an exchange rate on the portfolio level. If an exchange rate is defined, the values from the assets will be multipled with an exchange rate factor before being added to the portfolio.
For example, if the base currency of your document is european Euros, and you have invested in e.g. american stocks denominated in US Dollars you can still define these assets in your document by putting all your american stocks in one portfolio and define the rate of exchange between the Euro and the Dollar in that portfolio. This means that you define your assets in US Dollars including the transactions, but in the portfolio the values will be converted to Euros.
In order to define an exchange rate for a portfolio, select the portfolio in the value explorer and then select menu Value->Edit.... In the dialog select the tab for "Type" as shown below:
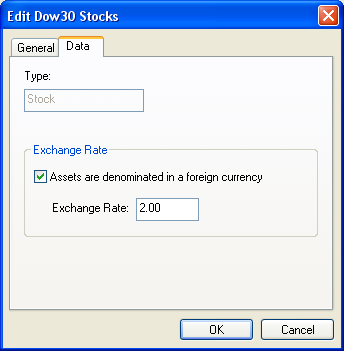
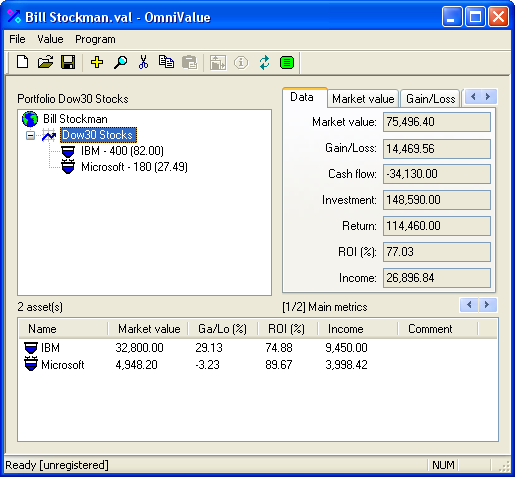
In this hypothetical example the value of one Dollar is equal to two Euros. This means that the exchange rate will be 2.0 to convert any values in dollars to euros. After having defined this exchange rate the values in the portfolio will be in euros, whereas the assets and the transactions are in dollars. This can be observed in the following view by comparing e.g. the market value for the portfolio in the data panel with the sum of the market values for the two assets in the list.
There is also an alternative way of handling a foreign currency which is based on defining a custom value type. This is primarily useful for describing foreign bank accounts in other currencies. An example of this procedure is given in the chapter for value types.
For transactions that generate a return the tax method and tax rate can be set in the Edit dialog for the transaction (the choice of tax method is available only for sell transactions).
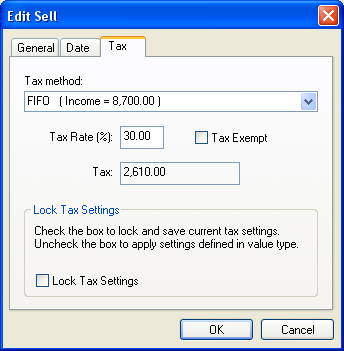
OmniValue supports three different tax calculation methods:
OmniValue will calculate tax for all enabled methods and by default select the method that minimzes the tax. The choice of tax method and tax rate can however be manually set in the tax dialog for the transaction. Check the box for "Lock Tax Settings" to save the settings permanently.
To change the the way OmniValue calculates tax and applies tax rates the definitions for the underlying value type must be changed (in this case the value type Stock). This is further described in the chapter for managing value types.
The dialog for settings is invoked by selecting Program->Settings... The tab for general settings include the following:
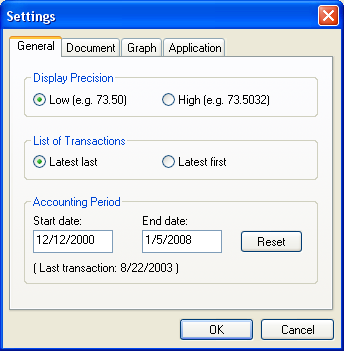
The display precision can be set to low (2 decimals), or high (4 decimals). This setting only affects the output display data. The input data, and the internal number representation uses high precision (16 significant digits).
The order in which transactions are listed in the transaction lists can be changed to either have the last transaction listed last in the list, or listed first in the list.
The accounting period is continuously updated during runtime from transaction data in the document. A different accounting period can be defined, e.g. with a time span of a specific calendar year (for example 1/1/2007-12/31/2007). Note that changing the accounting period will affect all data in the calculations, such that the icons for the assets may change completely, depending on what kind of transactions that were in scope during the specified period. Selecting the Reset button will restore the accounting period back to the entire time span of the document.
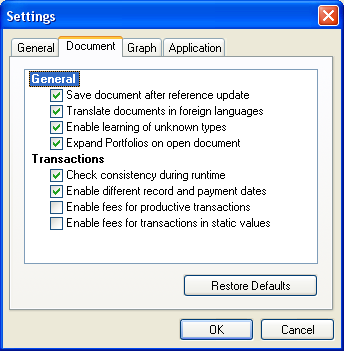
The settings for the document include the following:
The settings for the graph include the following:
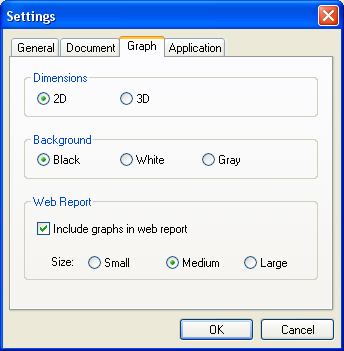
In the "Dimensions" box, the number of graph dimensions can be set to either 2D or 3D.
In the "Background" box, the graph background can be set to Black, White, or Gray ("Windows Classic Gray"). This setting will only affect the user interface, the background in the web report is always white.
In the "Web Report" box, graphs in the web report can be included or excluded. If graphs are included in the web report, the size of the graphs can be set to Small, Medium, or Large.
The settings for the application are:
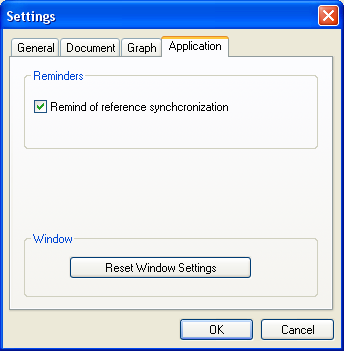
The reminder of reference synchronization can be switched off by unchecking the box. All window settings including the main window size and position and all list column widths etc can be reset to default values by pressing the button at the bottom of the dialog.
© Milliplex